Physics > Motion > Kinematics - GRAPHS - one-dimension - constant acceleration--> velocity varies linearly
Accelerated motion
Analysing accelerated motion graphs:
There are 2 types of graphs in this case: the s x t graph, like before, but because the velocity varies we will also plot the v x t graph (examples below).
The v x t is a straight line ,like s x t in the case of uniform motion, and the gradient in this case is the acceleration, that is the rate at which velocity changes. For our purposes it will change uniformly so that we get a straight line graph They displacement is vt so its the area under the v x t graph.
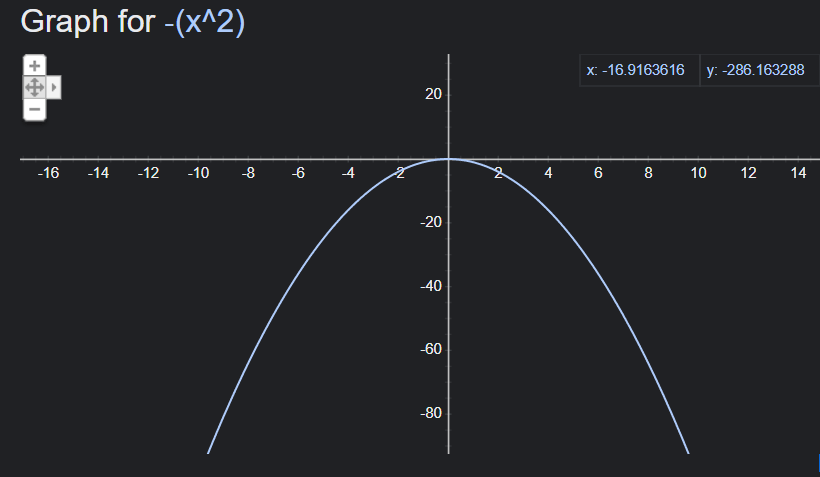
In the case of the plot s x t for the accelerated motion we don´t get a straight line so that there is no gradient or anything to be easily calculated. We can just say the the concavity (mouth) of the parabola is facing up (positive mathematical function)or down (negative mathematical function).
Example - v x t graph
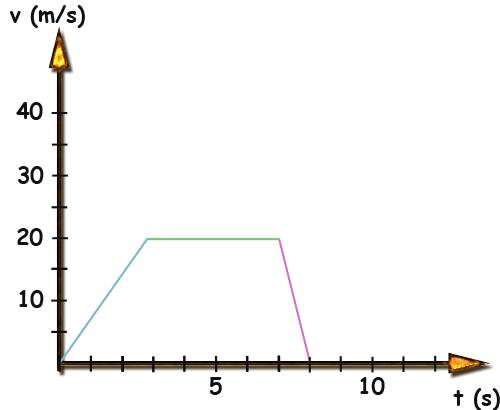
graph v x t
Calculation acceleration:
Blue line : gradient = 20/3 -->a = 6.6 m / s2
green line = constant speed = 20 m/s --> a = 0
purple line --> a = - 20 m / s2
Calculation of distance travelled:
s = v*t
Example: A car travels at 50 miles / h, during 3 hours
d = 150 miles
Graphically, it is the area under the vxt graph:
For the green line --> 20 * 4 = 80 m
The total distance is the area of the trapezium (made of the blue, green and purple lines) --> 1/2 * 20 ( 8+4) = 120 m
__________
distance travelled during acceleration (area under blue line) --> 10*3= 30 m
__________
distance travelled while breaking ( area under purple line)--> 10 *1 = 10 m
Notice that the gradient of the purple line is negative, so that this negative acceleration means breaking (when the velocity is positive). That means, velocity to the right and acceleration to the left , opposing the movement.
Example - s x t graph

Parabola with concavity facing upwards. (graph by Google)
These graphs can be produced in Google just by typing the function on the search bar.
In our case y represents s and x represents t
Parabola with concavity facing downwards. (graph by Google)
Motion graphs simulator
I made a simulator where you can accelerate an object and check the corresponding graphs. Below I show some examples of the output for 2 different accelerations:
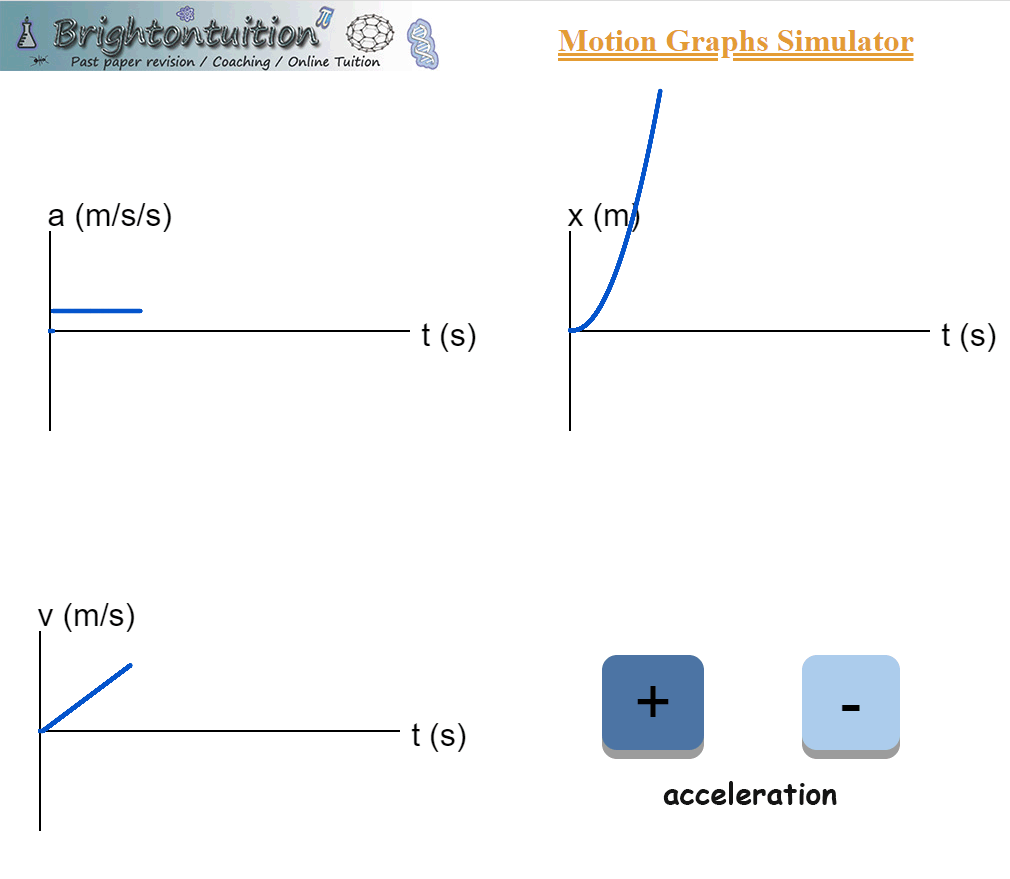
Frame from my simulator - acceleration a
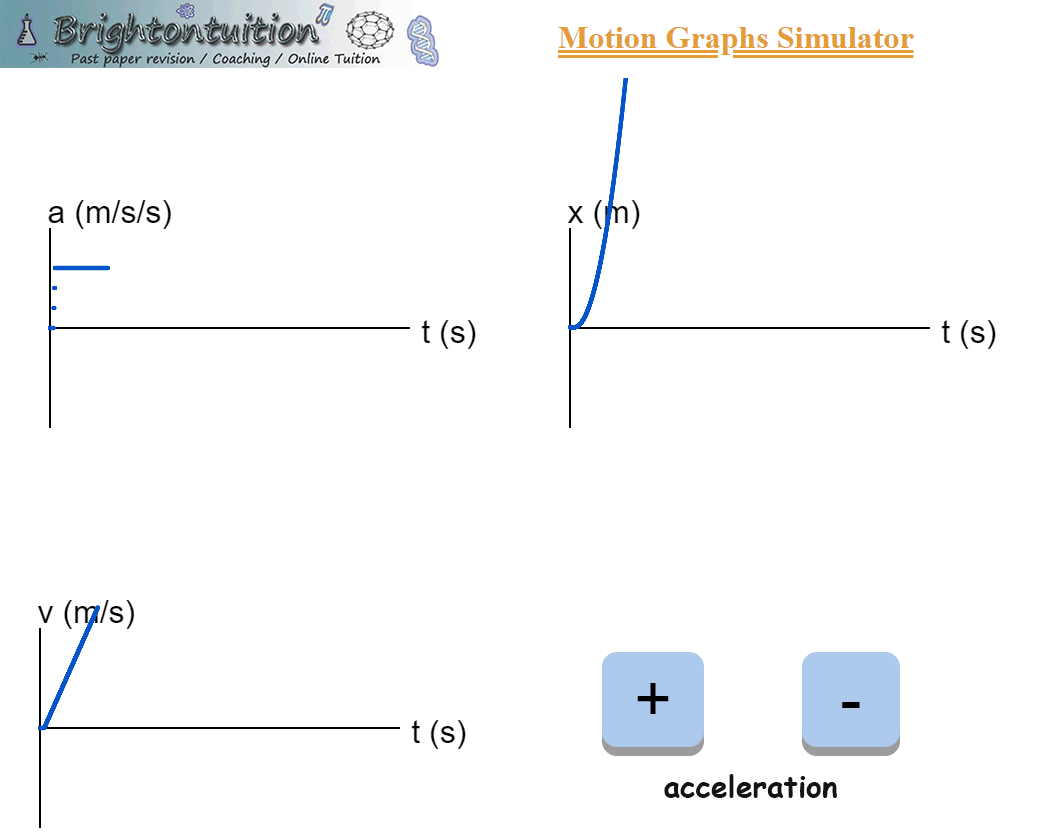
Frame from my simulator - acceleration 3a
It is interesting to notice that differences on the 3 graphs. Firstly we see on the acceleration graph that the acceleration on the graph below is 3 times bigger. The other 2 graphs shows the consequences of that. On the graph below the v x t graph is steeper and the s x t graph is a parabola that rises faster than in the graph above.