Graphs are a great help in physics and in this topic in particular. There are very useful quantities that can be calculated from them, including the gradient and the area.
The gradient is a measure of the slope of the graph and it is given by "rise over run". The higher the incline of the line graph, the higher the velocity.You can also think of the tangent of the angle the line makes with the x axis. You imagine a rectangle triangle find the tangent of the angle, which is called alpha in the example below:
Uniform motion
Example calculation 1
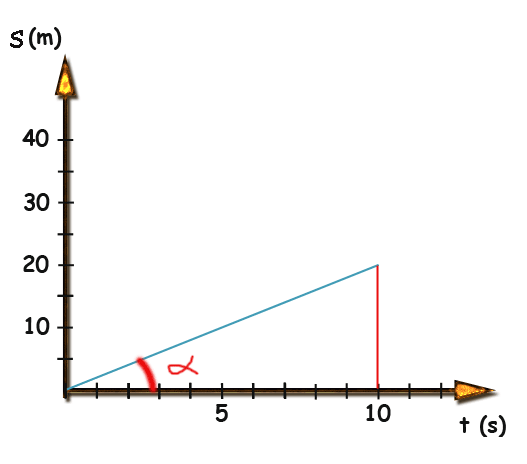
This is a s x t graph and its gradient is the velocity. The gradient is the slope of the graph. Mathematically it is calculated easily because it is the tangent of the angle α (alpha), so that it is given by the opposite side of the angle in the triangle shown (20 -the height of the red line) divided by the adjacent side (10). That is:
v = d / t = 20 /10 = 2 m / s
This way we can do some calculations directly from the graph.
Example calculation 2
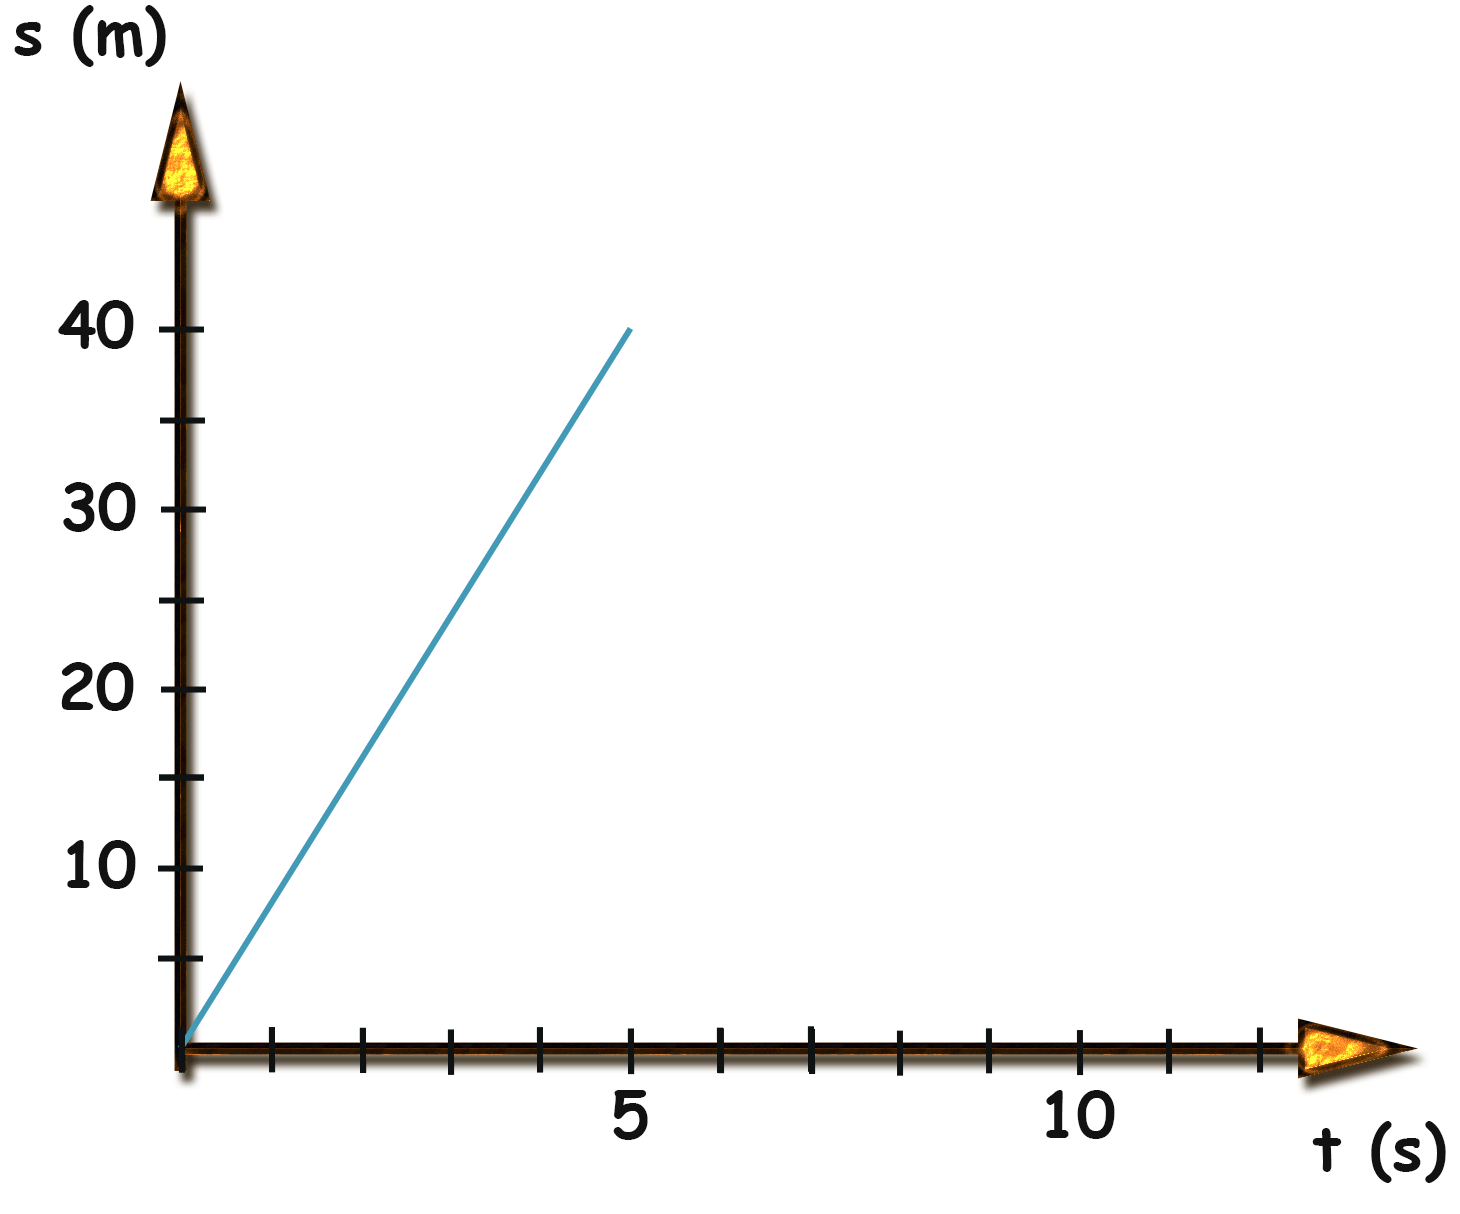
v = 40 / 5 = 8 m / s
Example calculation 3
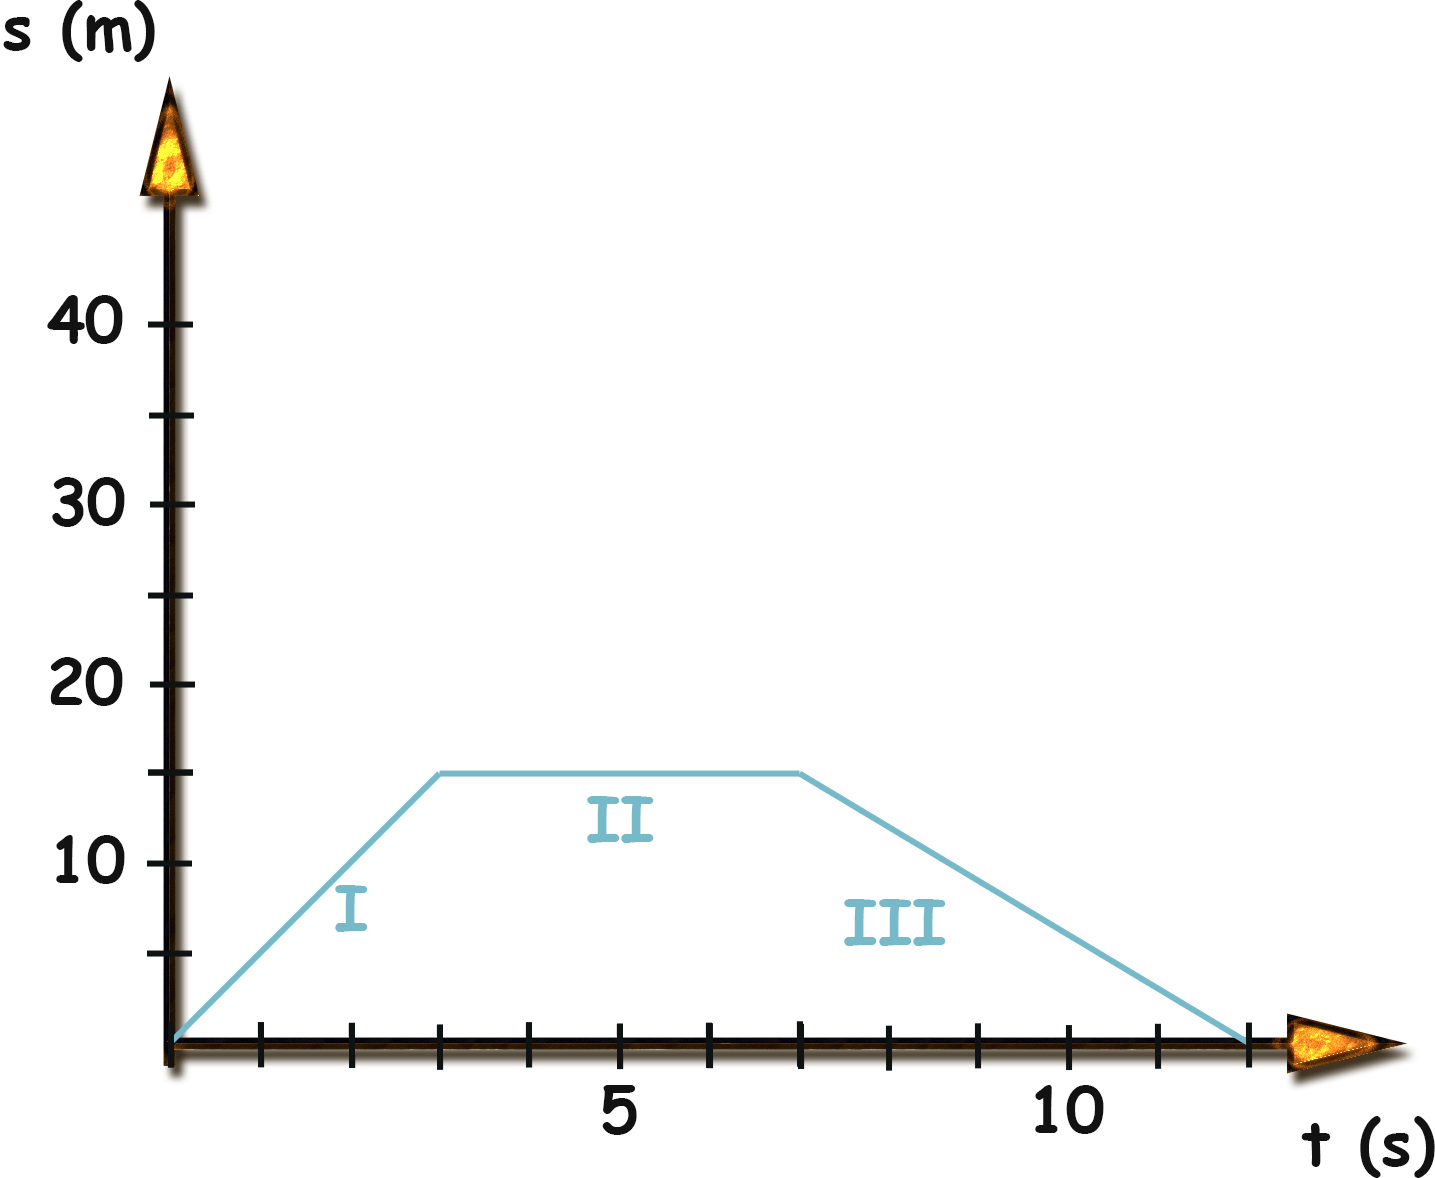
In this example the object stops after a few seconds and then comes back.
I - 15/3 = 5 m/ s
II - 0 Explanation: The gradient is zero (there is no slope)
III - 15 /5 = -3 m/s Explanation:The slope inclines the other way and that is why its gradient is negative. A negative velocity physically means that the object is coming back, or moving in the direction opposite to the positive.
EXERCISE
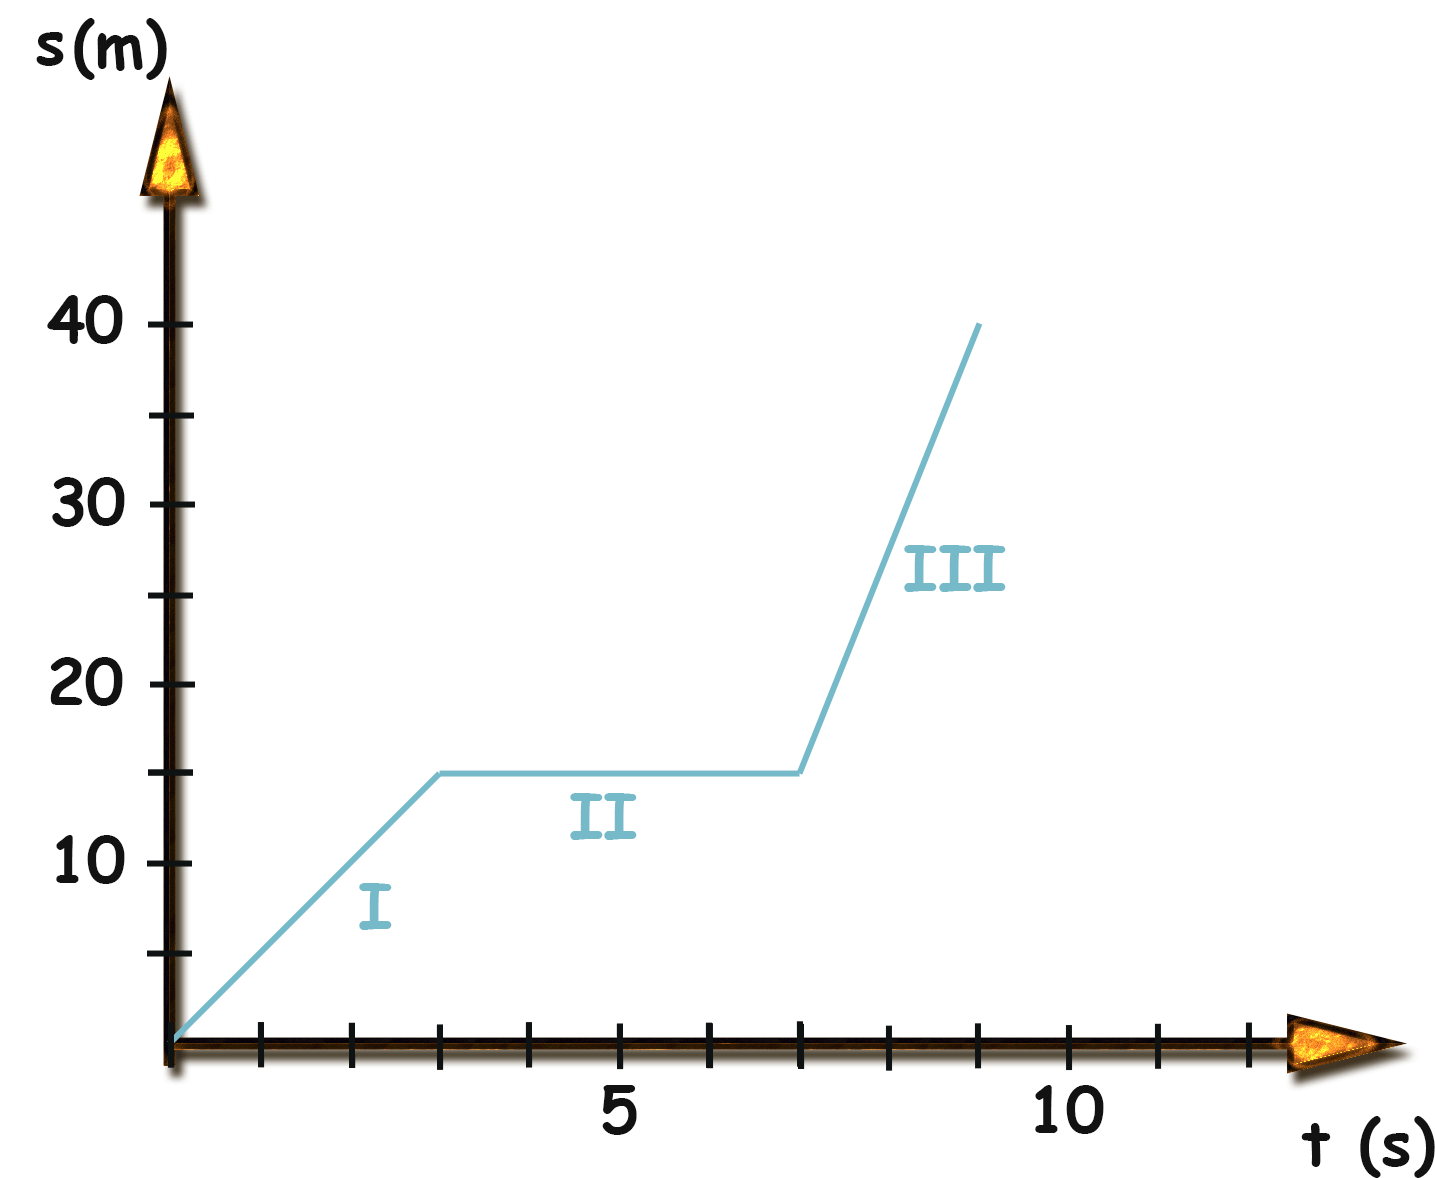
Explain what is happening here and determine the velocities in each stage of the journey.